INVESTMENTS
CUP WITH HANDLE PATTERN IN STOCK MARKET
WHAT IS CUP WITH CANDLE PATTERN
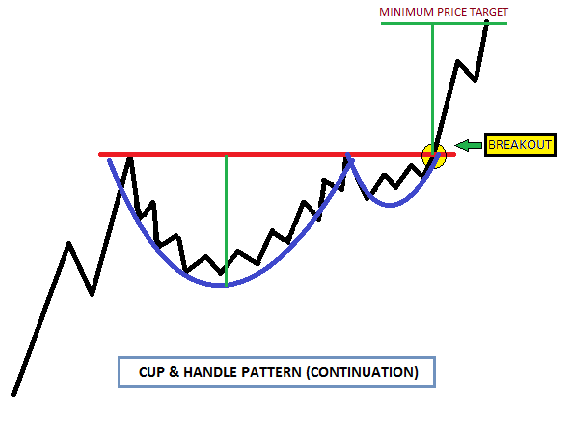
A technical signal that resembles a cup with a handle—where the handle has a small downward drift and the cup is shaped like a "u"—is called a cup and handle price pattern on the price chart of an asset.

The cup and handle pattern is seen as a bullish indication, and lesser trade volume is usually seen on the right side of the formation. The creation of the pattern might take up to 65 weeks, or as little as seven weeks.
KEY KNOWLEDGE
IMPORTANT TERMINOLOGIES
I. CUP
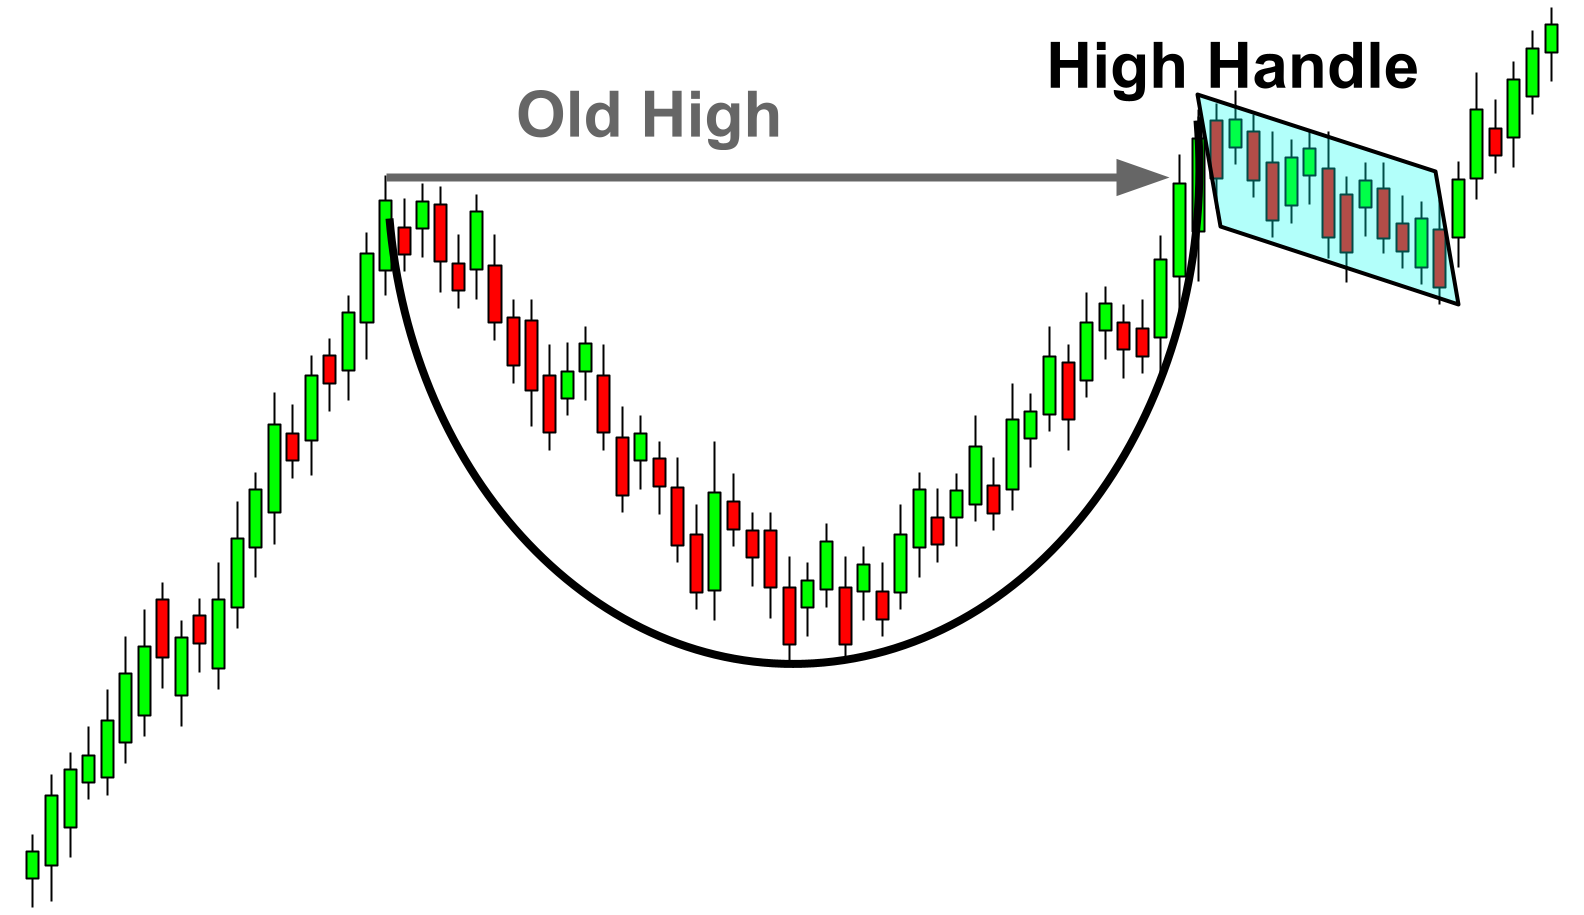
Typically formed like a "U," the cup has about equal heights on all sides and a rounded bottom. Though a "V" shaped cup can also be classified as a cup and handle pattern, a "U" shaped cup has a stronger conviction because of the consolidation at the bottom.
II. HANDLE
The handle is usually the pullback from the higher end of the cup which may be rounding, triangle, or a descending channel. Usually, the pullback is about 1/3rd of the size of the prior advance.
III. VOLUME PATTERN
Increased volume should follow the breakthrough from the resistance of the handle, verifying the same.
IV. PERIOD
The cup typically takes one to six months to develop, or more if it forms in weekly and monthly charts. The best time for the handle to develop is one to four weeks, or more if the cup is left unfinished.
V. TARGET
The projected target from the breakout is usually the vertical distance from the high to the bottom of the cup.
CUP WITH HANDLE PATTERN EXAMPLE
This is an illustration of the Cup and Handle continuation pattern in Nifty news, which developed over the course of almost two years. The index showed a gap up and a breakout from the pattern, confirming more strength.

In less than a year, the minimal goal—the distance from the top to the bottom of the cup—was accomplished. It is shown by a vertical blue line.
REVERSAL PATTERN
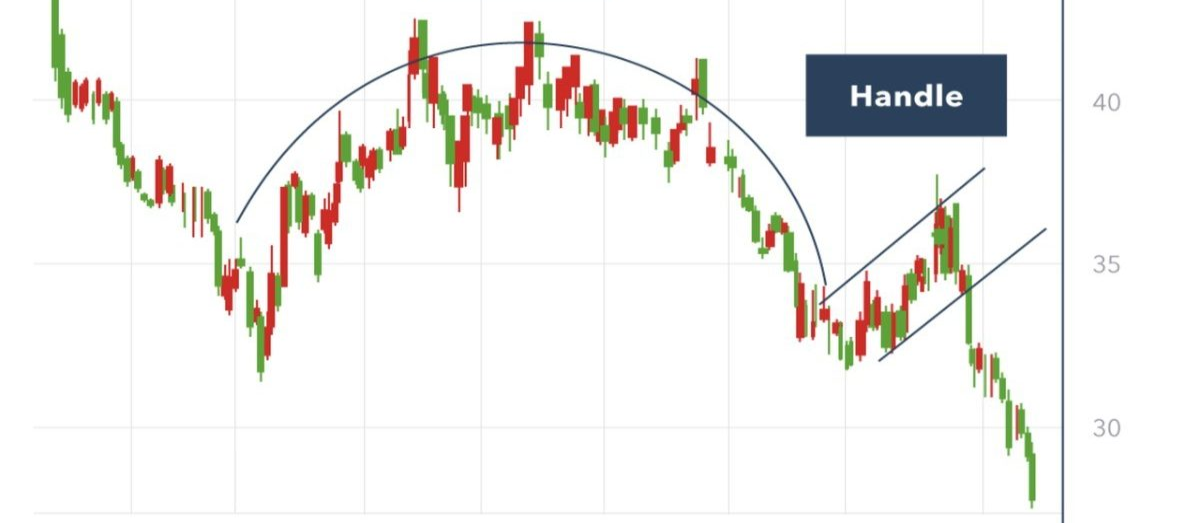
The handle appears more like an ascending triangle breakout, and the stock had a strong rebound in the two to three weeks that followed the breakout. In this stock, the minimum objective has not yet been met; events might take place in the upcoming weeks.

Related Articles: