The trend-following Alligator indicator was created by market psychology pioneer Bill Williams. It is based on the idea that individual stocks and financial markets only move 15% to 30% of the time, with the other 70% to 85% of the time being spent grinding in sideways ranges. Williams thought that during moments of strong trends, people and institutions often gather the most of their income.
KEY KNOWLEDGE
One technical analysis tool that makes use of smoothed moving averages is the Williams Alligator indicator.
The indicator begins by using a smoothed average that was determined using a simple moving average (SMA).
Three moving averages, with periods of five, eight, and thirteen, are used. The jaw, teeth, and lips of the alligator are made up of the three moving averages.
Convergence-divergence connections are used by the indicator to construct trading signals, with the Jaw turning slowly and the Lips turning quickly.
How does William Alligator Indicator Works?
Three smoothed moving averages—three Fibonacci numbers—at five, eight, and thirteen periods are used by the Alligator indicator. A simple moving average (SMA) is used to create the first smoothed average. Additional smoothed averages are added to slow down indicator rotations.
Calculation of William Alligator Indicator?
Simple Moving Average(SMA):
SUM1 = SUM (CLOSE, N)
SMMA1 = SUM1/N
Subsequent Values are:
PREVSUM = SMMA(i-1) *N
SMMA(i) = (PREVSUM-SMMA(i-1)+CLOSE(i))/N
Where:
SUM1 - the sum of closing prices for N periods;
PREVSUM - smoothed sum of the previous bar;
SMMA1 - smoothed moving average of the first bar;
SMMA(i) - smoothed moving average of the current bar (except for the first one);
CLOSE(i) - current closing price;
N - the smoothing period.
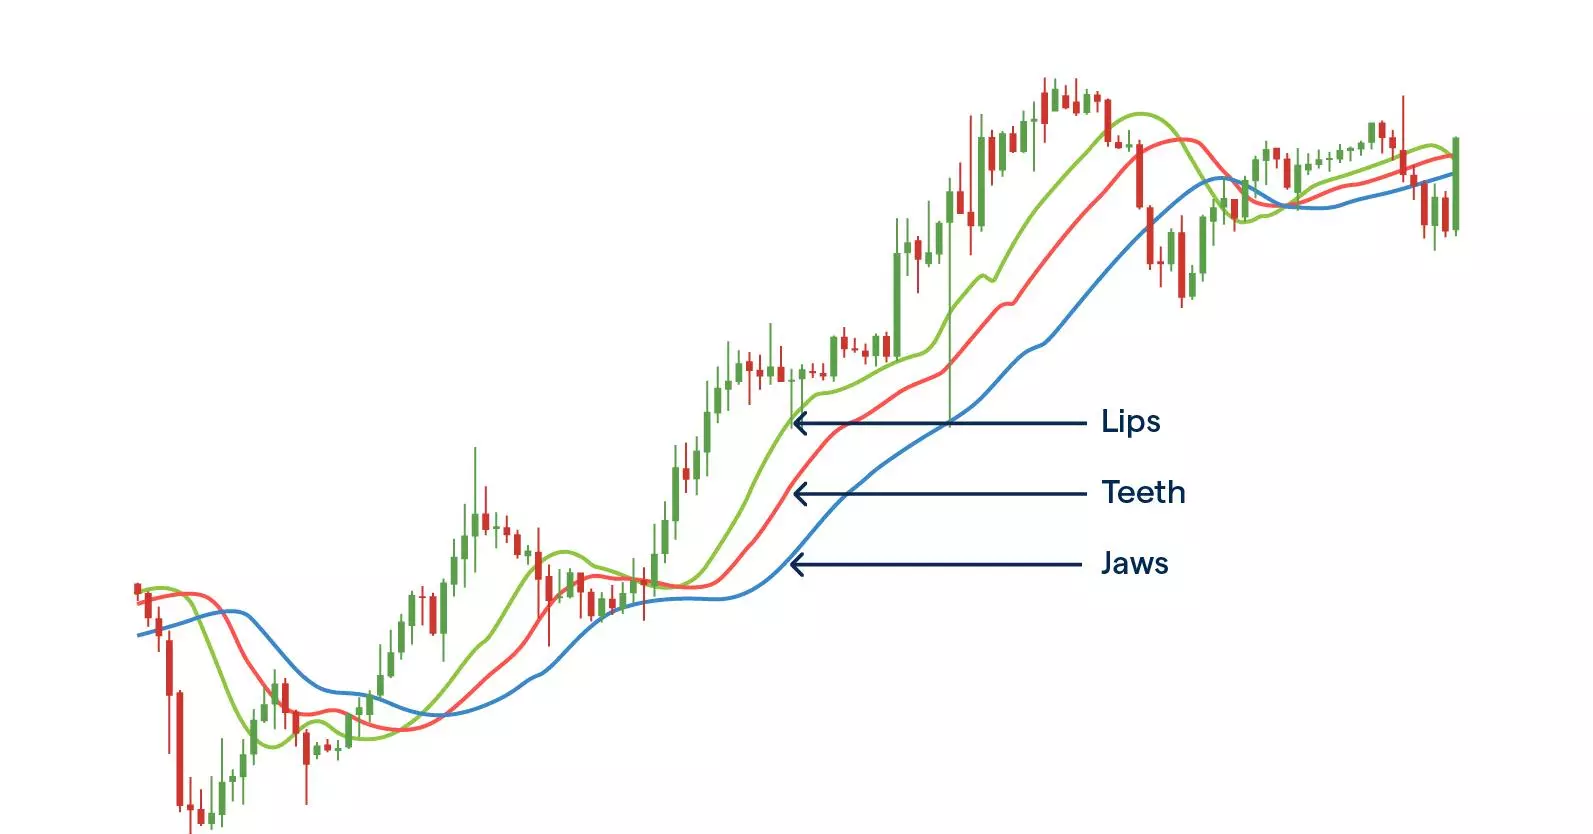
The three moving averages comprise the Jaw, Teeth, and Lips of the Alligator, opening, and closing in reaction to evolving trends and trading ranges:
Jaw (blue line): Smoothed by eight bars on succeeding values, starting with the 13-bar SMMA.
Teeth (red line): Smoothed by five bars on succeeding values, starting with the eight-bar SMMA.
Lips (green line): Smoothed by three bars on succeeding values, starting with the five-bar SMMA.
The following analogy may be used to demonstrate how the indicator functions. An alligator is either sleepy or exhausted when its mouth, teeth, and lips are closed, causing its moving average lines to blend together. Because the trend is too weak at this point, many traders choose not to enter the market.
The alligator grows more ravenous the longer it sleeps, and when it awakens, it is prepared to kill bulls and bears. The alligator consumes until it is satisfied by opening its jaws, which cause its lines to uncross and travel upward or downward.
When rough market circumstances cause the three lines to cross each other frequently, the indicator will flash false positives. Williams said that the alligator is currently "sleeping". waits for it to wake up again before moving on.
Example of William Alligator Indicator:
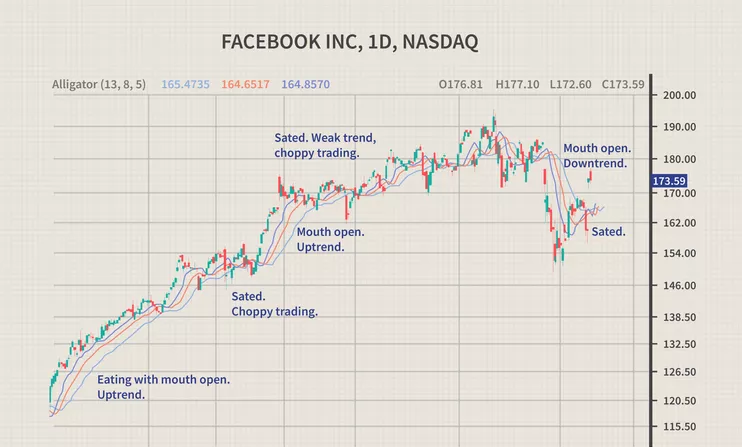
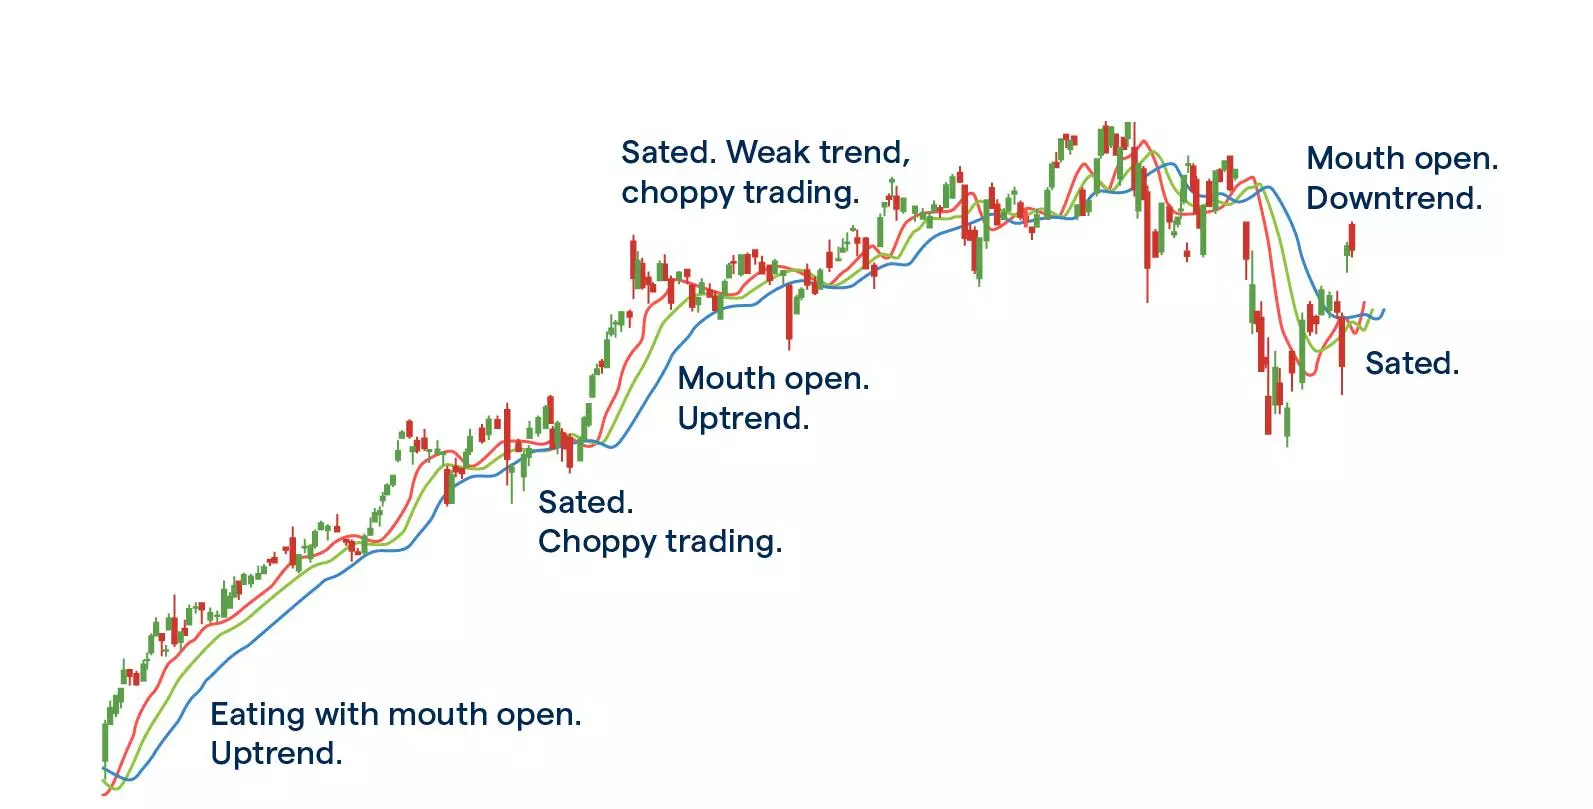
Near the bottom left of the chart, Meta, previously Facebook (META), displays an alligator "awakening" signal. Following this, the company enters a robust uptrend, displaying an alligator "eating with open mouth" phase. The price falls to the Jawline as the indicators are rising, but they do not cross. The tendency is still upward. When the price goes sideways and the Lips cross below the Teeth and Jawlines, an alligator "sated" sell signal appears.
The alligator "sleeps" for a while, and then another "eating with an open mouth" phase begins, signaling the start of a new rise. The price is still rising, but not quickly. Subsequently, a sell-off occurs, indicating a downturn as the mouth expands to the downward. An additional crossing of the lines indicates that the alligator is "sated" It stays on the sidelines until the mouth opens again.
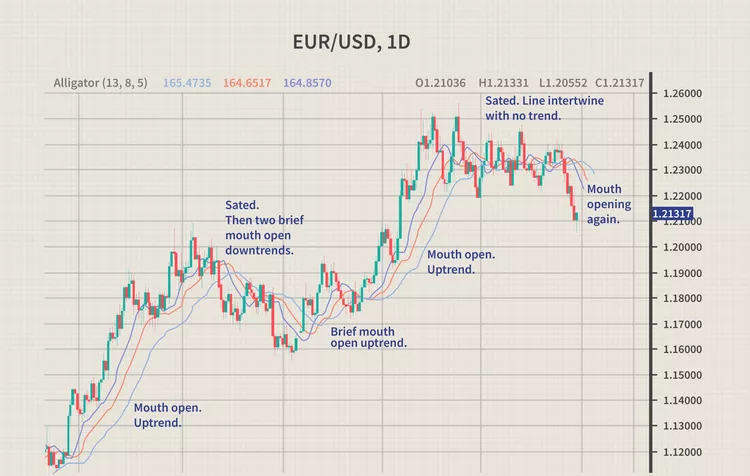
The Alligator opens up in the lower-left corner of the chart, and an uptrend holds for a while. Following the lines' intersection, two minor downtrends emerge. A purchase signal to the upward follows, resulting in a temporary rally. The Alligator is satisfied when the price retreats, and it then opens up for a significant upswing once more. An lengthy sideways phase, during which the indicator lines cross over one another, comes next. It is recommended for most traders to avoid this sleeping phase. A decline is indicated by the Alligator opening its jaws once more, or waking, to the far right of the chart.
So now, the alligator has lost interest in the food and it closes its mouth to rest (lines move closer together). This is when some traders close their positions if they’ve made a profit, as the upward or downward trend may have come to a halt.
How to Trade Williams Alligator Indicator?
Lack of Market Trend:
when the green, red and blue lines are very close to each other or intertwined
The Formation of a Trend:
when the red and blue moving averages are heading in the same direction, the green moving average passes through them, and all three end up going in the same direction
Trend Direction:
The three lines can only move in parallel for there to be a trend. There is an upward tendency when the red line is above the blue line and the green line is above the red line. The market is in a downward trend if the lines are arranged in reverse order (blue top, red middle, green bottom). The tendency is validated as the lines get wider.
Frequently Asked Questions:
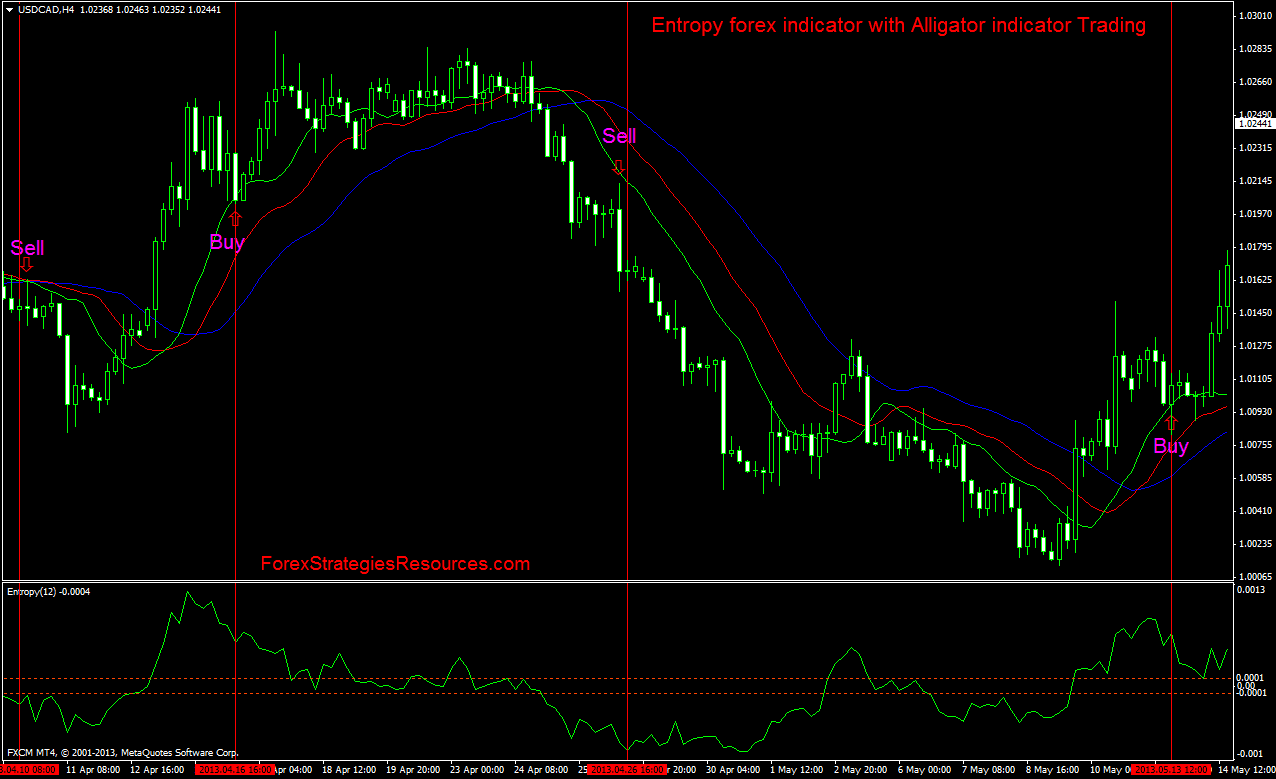
If you think the alligator indicator is signalling an uptrend, you can open a 'buy' position (go long). This enables you to profit from increasing forex prices. If you think the indicator is suggesting a downtrend, you can open a 'sell' position (go short), which enables you to profit from falling FX prices.
The fractal is indicating the possibility of a trend change. This is because fractals are essentially showing a "U-shape" in price. A bearish fractal has the price moving upward and then downward, forming an upsidedown U. A bullish fractal occurs when the price is moving down but then starts to move up, forming a U.
The Alligator indicator works by plotting multiple moving averages on the price chart. It uses the three moving averages called jaws (blue line), teeth (red line) and lips (green line) to represent price trends.